


Turn Data Into Insights With The New Railz Visualization SDK

At A Glance
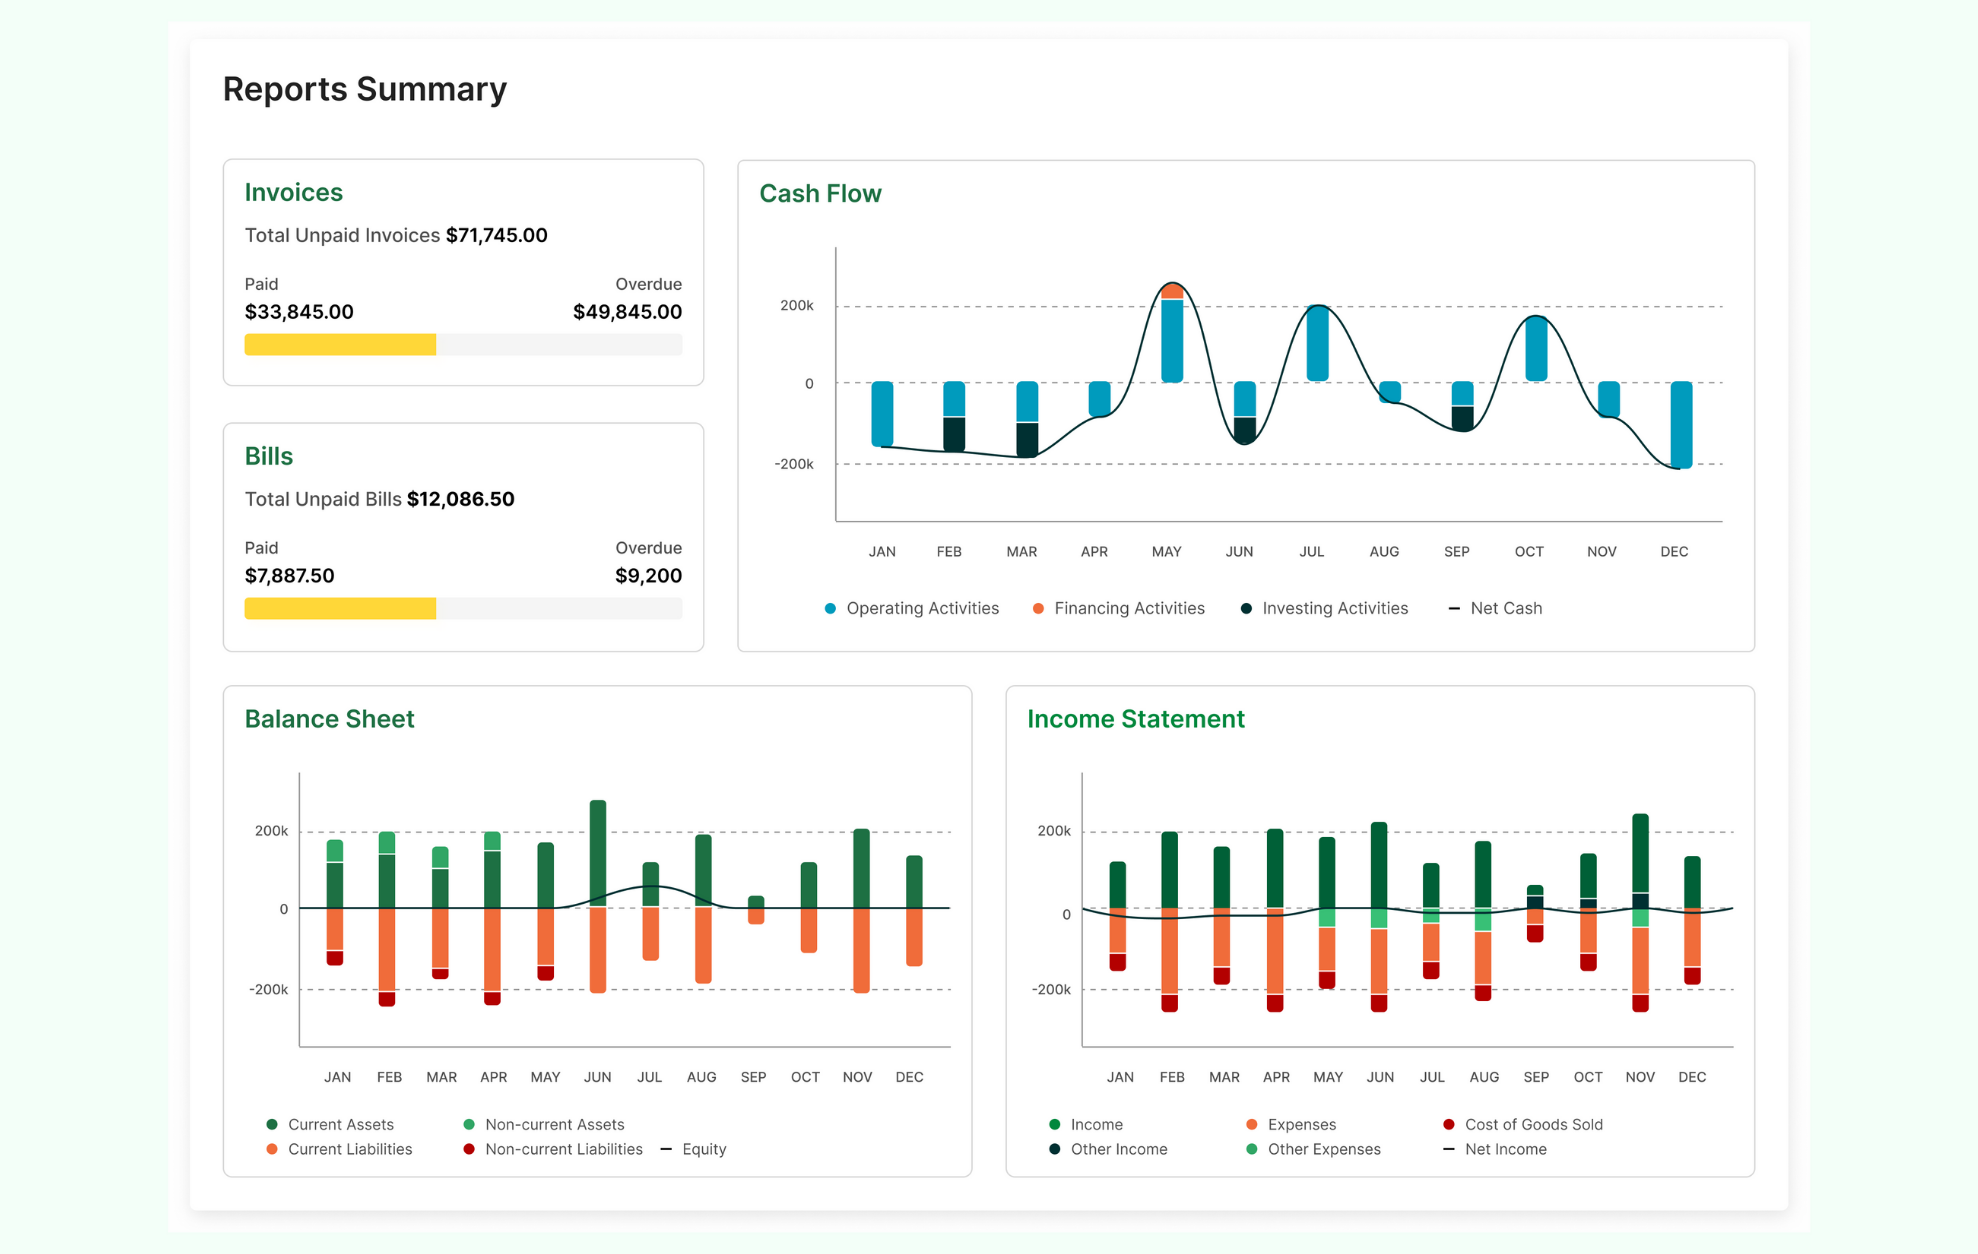
- Build customized financial dashboards
- Visualize key metrics in real-time
- Develop the next generation of embedded finance products
What is Railz Visualization SDK?
Railz Visualizations SDK is a collection of standardized web components that help our customers build detailed and informative dashboards. Built on top of our industry-leading financial data normalization and analysis API, this SDK comes packed with component properties that can be quickly customized to match product needs.
How does Railz Visualization SDK help your business?
Embedded finance streamlines financial processes and data for its consumers. Beyond having access to this data it is important to be able to create the correct insights from it, which would in turn be a vital asset for tomorrow's business development.
By combining our Accounting Data API with the Visualization SDK, our customers can offer these quick and digestible insights. It removes the data streamlining barriers and paves the way for making more informed decisions, allowing our customers or their clients to focus on growth opportunities.
Available as a complete white-label solution, the Railz Visualization SDK, allows our customers to design a fully-embedded finance dashboard that works within their branding and marketing guidelines and elevates the relationship between our customers and their client.
Let's review some potential use cases of the Railz Visualization SDK
Scenario 1: Cash Flow Monitoring
A large Financial Institution needs to build a customized dashboard that demonstrates a detailed picture of its business clients' cash flow. They embed the cash flow visualization component of the Railz Visualization SDK into their dashboard and customize it to fit within their workflow. This allows them to better understand what happened to a business's cash during a specified period, like the beginning of the global pandemic for example and they can also model possible scenarios of business outcomes with cash injections at the right time. This data can not only be presented internally to our customer, but also outwards to the clients of our customer.
Scenario 2: Financial Health Metrics
An Underwriting organization has a complex job assessing financial factors like the credit history of its clients. Determining what's eligible for approval based on a company's risk assessment is a time-consuming and risky task. The organization uses a business customer portal to conclude each business. They embed the Railz Visualization SDK into the portal to visually showcase the data to interpret a business' income statement, bills, invoices, and balance sheets. Having access to these data sets that summarize the revenues, costs, and expenses incurred, the amount of debt owed, and the cash equivalents during a specified period can help them paint a picture of a business's financial health. They can also draw patterns of how well a company performs during different periods by setting the built-in filters in the Railz Visualization SDK.
To sum it all up, Railz Visualization SDK provides a visual summary of the financial health of a business that can be consumed by our customers or surfaced back to their end-users as part of other business-facing initiatives.
Most of all, the Railz Visualization SDK simplifies building a customized dashboard for our customers without worrying about spending money, time, and resources on finding the right charting tool, creating a dashboard from scratch, or worrying about transforming and plotting financial data.
A little bit of the technical background and SDK features? Sure.
Railz's team has developed its visualization SDK by employing TypeScript programming language and StencilJS compiler to save its customers' time and development resources. This gives them a streamlined development experience while utilizing a set of fully-typed components in the most popular frontend frameworks.
The Visualization SDK simplifies building tailor-made dashboards. The white-labeled solution adapts to mobile interfaces, so all of its components are compatible with any screen size. The key Railz Visualization SDK features for developers include:
- Universal Framework Compatibility: Railz Visualizations makes it simple to use and implement its packages in any framework or none at all. Railz achieves this by utilizing web platform APIs and standardized Web Components.
- Full Customization: Build charts that match your branding guidelines. See the component properties page for more details.
- Responsive Design Elements: All of the components were created with the mobile user in mind and are compatible with any screen size.
- Typed: TypeScript programming language is used to create the components, allowing you to enjoy completely-typed components.
- Accessibility: Railz Visualizations comes with built-in accessibility. We understand how important it is for everyone to visit your website.
- Components
- Visualization Controls - this is used to display the status of bills and invoices
- Statement Visualizations - this is used to display financial statements like Income Statements, Cashflow Statements, and Balance Sheets.
- Loading Indicator Component
- Error/Status Image component

Gabriela Gonzalez is a Product Owner at Railz. She works with the product and engineering team on the Platform squad to understand and represent customer needs, create the user experience and connectivity flow to our products, and develop and manage our customer dashboard to provide data insights and analytics. She has been working in the technology industry for over 4 years and she values taking a data-driven approach to building products to help solve customer problems.